Dashboards allow you to measure different groups of videos over time, including but not limited to:
- Videos published by one Creator or group of Creators
- Videos published by one property or group of properties (e.g.: your competitors)
- Videos about a certain type of content (e.g.: unboxing videos)
- A subset of videos published by one or more properties (e.g.: a campaign or series)
- A subset of videos published to specific platforms (e.g.: your YouTube channel or your competitor’s Facebook page)
Dashboards enable you to understand historical performance and trends over time for any slice of the video universe.
On This Page:
- Navigate and Manage Dashboards
- Select a Date Range
- Trends Graph
- Table Summary
- Accounts Generating the Most Views
- Audience Insights: Dashboard Demographics
Navigate and Manage Dashboards
On the left hand side of the Dashboard is the sidebar where Tubular’s Featured Dashboards (at the top) as well as your own saved dashboards are located. Clicking on any dashboard title will populate the associated data.
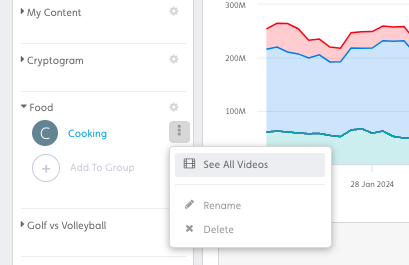
To rename, delete, or view all videos within a Dashboard: Hover over the dashboard title and click the options menu () to the right of the title, and select your preferred action.
Organizing your Sidebar
You can create different Dashboard Groups in the Sidebar to organize your existing dashboards. Dashboards can be dragged and dropped into different Dashboard Groups depending on your needs:
To Add a Dashboard Group:
- In Dashboard, click the plus (+) icon below your last search.
- Type the desired Dashboard Group name and press Enter on your keyboard.
To Remove a Dashboard Group:
- In Dashboard, click the gear (
) icon to the right of the Group name and select Remove.
To Change a Dashboard Group Name:
- In Dashboard, click the gear button to the right of the Group name and select Rename.
- Type the new Group name and press Enter on your keyboard.
Change Dashboard Group Order:
- In Dashboard, click the Group name and drag the Group to your desired location.
Compare
Click Compare under a Group with multiple dashboards to open a comparison view across multiple dashboards within that Group. This is a useful way to look at share of voice and to conduct competitive analysis. By default, you will see a comparison of the top 10 dashboards in the graph and table. To compare across the top 25 dashboards, export the page.
Select a Date Range
The date range menu at the top right allows you to select from relative date filters (Last 7 days, Last 30 days, etc.) or specify a custom date range to see the performance of a dashboard within the selected timeframe.
Trends Graph
The trends graph provides a visual representation of the data in your dashboard. Using the dropdowns above the graph, you can customize the following components:
- Graph Type: Line, Stacked Line
- X-Axis metrics - Time Intervals: Daily, Weekly, Monthly
- Y-Axis metrics - Success Metrics: Views, Engagements, Uploads
When in the Daily view, you can click on any date in the graph to see the top performing videos for that day broken out by platform, which helps you understand what drove performance for that day:

You can also compare two or more dashboards in the Trends Graph by enabling Compare Mode located above the Trends Graph. An Add Comparison button will appear below the graph, enabling you to select any number of existing dashboards to overlay:
Table Summary
Below the graph is a table displaying total views, engagements, and uploads that occurred for all videos during the time frame selected, regardless of upload date, split by platform. Here, you can find the top performing videos uploaded during the specified time frame, ranked by total number of views. These top videos can be broken out by platform by selecting any of the platform subtabs. To take a closer look at these videos in Video Intelligence, select the See all button beneath the list:
Accounts Generating the Most Views
In this section, you'll find top performing accounts during the specified time period, ranked by total number of views received on the accounts' videos that fall within your selected dashboard. These top accounts can be broken out by platform by selecting the platform subtab above the Video Deep Dive.
Audience Insights: Dashboard Demographics
Gender, Age, and Location information based on a Dashboard’s engaged audience is available for YouTube only. This data is aggregated up from engagements on the videos within the dashboard, and covers the last 6 months of data. Please note that demographics is not available for all Dashboards, but only those that meet a minimum threshold of unique engagers.
For more information on audience data, please see Audience Demographics.